As we enter the long-hot-home-stretch to the end of summer, let’s recap the June market data for buyers, sellers and investors looking to make their next move.
June 2022 brought 5.12 million in sales and a median sales price that is up 13.4% year-over-year. The median sales price hit $416,000 in June. In May, the median sales price exceeded $400,000 for the first time in history when it rose to $407,600. Inventory actually remains historically low, but grew to 3.0 months of supply in June— the first year-over-year increase in many years.
Normalcy is brewing. Stabilization is in the conversation. But, market shift is still a reality.
Is Stabilization Ahead?
Let’s take a look at the stats:
Existing Home Sales – June 2022
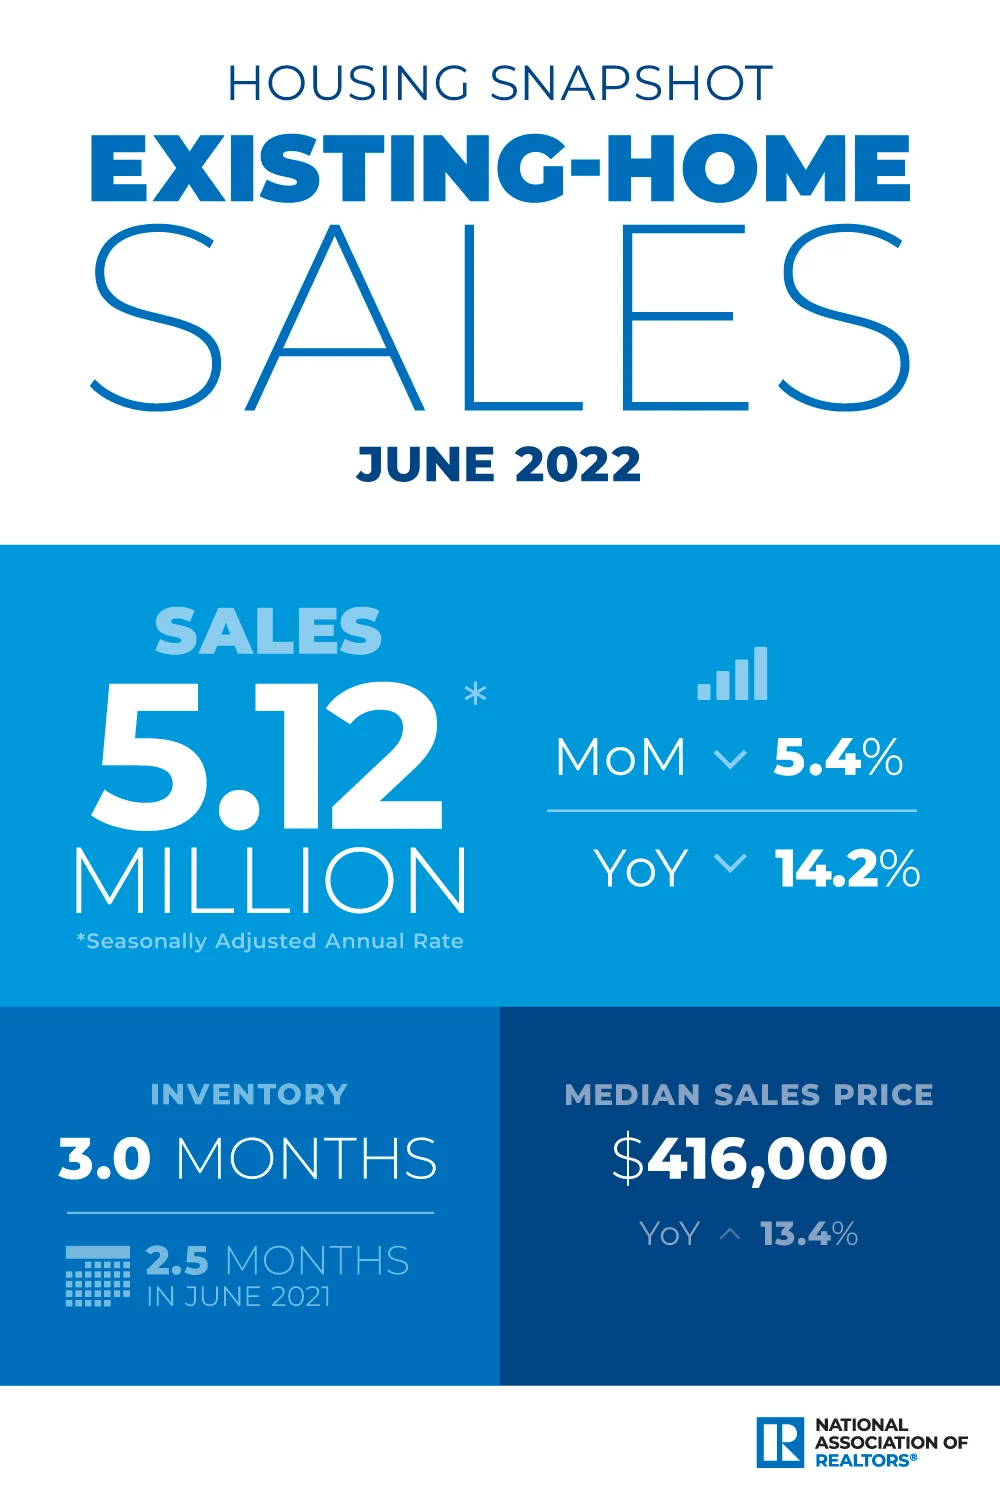
Existing home sales declined for the fifth straight month. Sales were down 5.4% from May and 14.2% from one year ago.
The median existing home sales price climbed 13.4% from one year ago to $416,000-a new record high. This marks 124 consecutive months of year-over-year increases, the longest running streak on record.
The inventory of unsold existing homes rose to 1.26 million by the end of June, or the equivalent of 3.0 months at the current monthly sales pace.
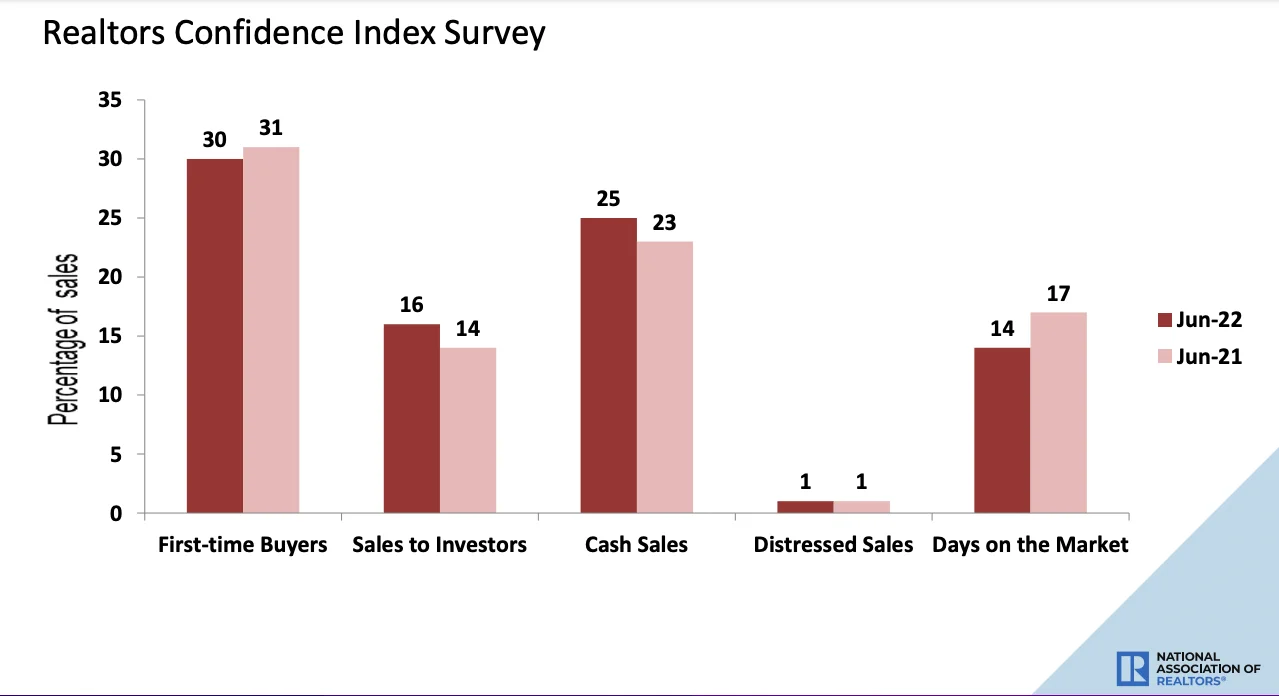
Properties typically remained on the market for 14 days in June, down from 16 days in May, and 17 days in June 2021. The 14 days on market are the fewest since NAR began tracking this metric in May 2011. Eighty-eight percent of homes sold in June 2022 were on the market for less than a month.
“Finally, there are more homes on the market,” says NAR Chief Economist Lawrence Yun. “Interestingly though, the record-low pace of days on market implies a fuzzier picture on home prices. Homes priced right are selling very quickly, but homes priced too high are deterring prospective buyers.”
Pending Home Sales – June 2022
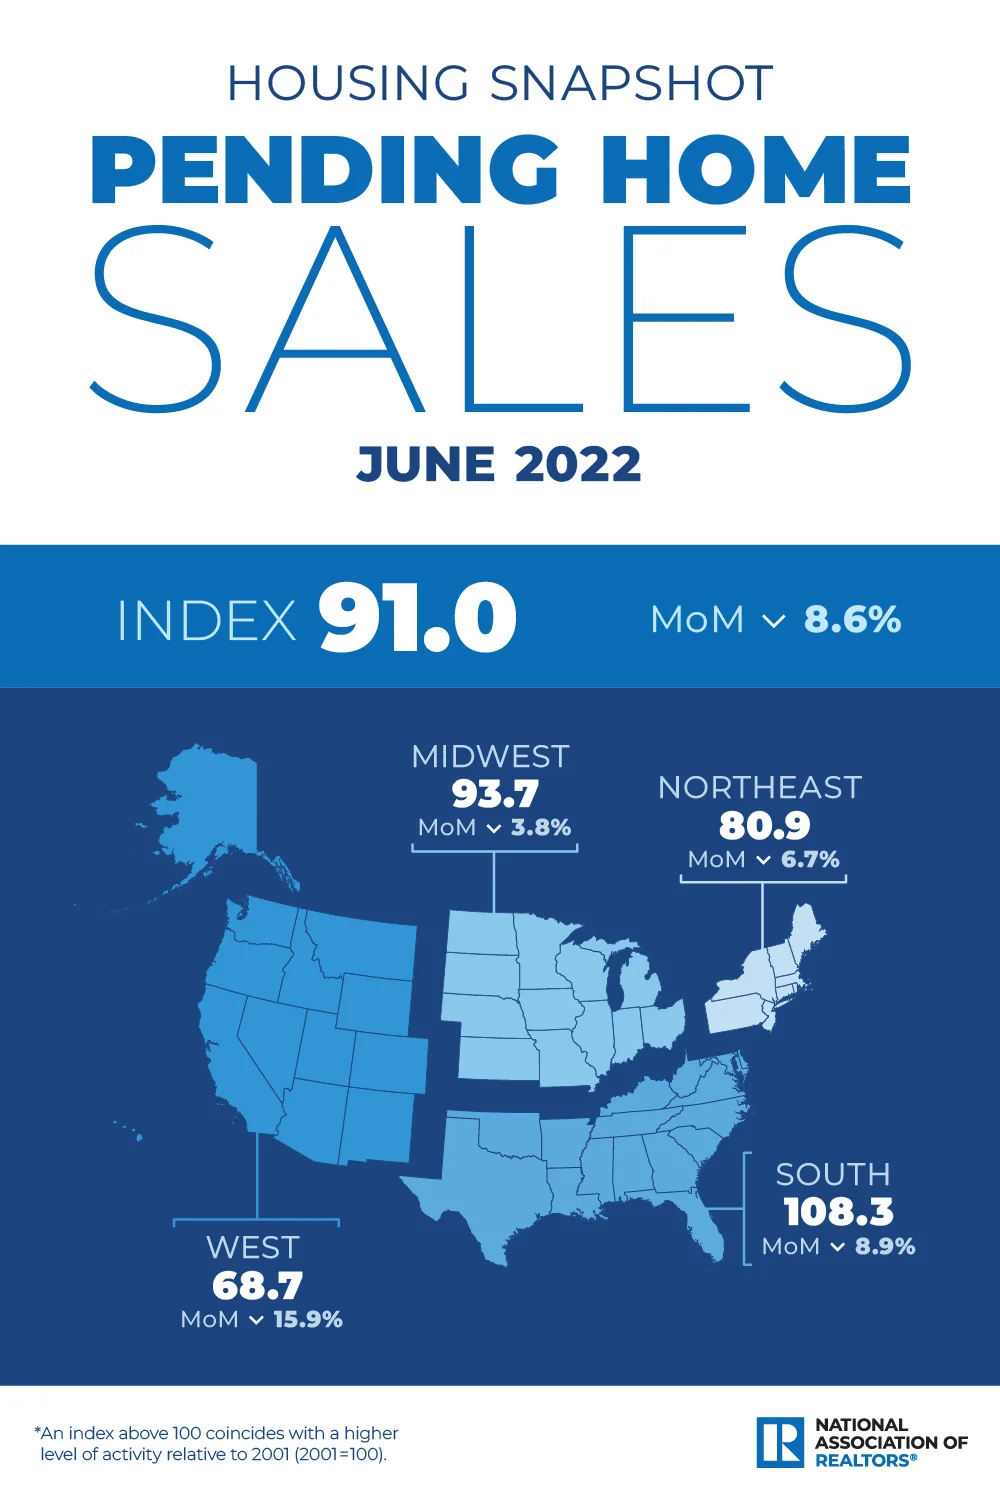 Pending home sales declined 8.6% from May. Pending contracts are a good early indicator of sales closing in the coming months. The National Association of Realtors developed the Pending Home Sales Index (PHSI), and began tracking pending sales in 2001 to have a metric that looks ahead instead of only having data points that look back. Closings typically take 1-2 months to complete and becomes a backward looking data point that doesn’t reflect current market conditions.
Any number above 100 indicates a higher level of activity, relative to 2001. As you can see from the graphic above, pending sales were down across all four major regions with the West experiencing the largest monthly decline.
“Home sales will be down by 13% in 2022, according to our latest projection,” Laurence Yun added. “With mortgage rates expected to stabilize near 6% and steady job creation, home sales should start to rise by early 2023.”
Who are the current market buyers?
First-time buyers were responsible for 30% of sales in June, up from 27% in May and down from 31% in June 2021.
All-cash sales accounted for 25% of transactions in June, the same share as in May and up from 23% in June 2021.
Individual investors or second-home buyers, who make up many cash sales, purchased 16% of homes in June, unchanged from May and a slight increase from 14% in June 2021..
Distressed sales – foreclosures and short sales – represented less than 1% of sales in June, essentially unchanged from May 2022 and June 2021.
As for current market Mortgage Rates?
Mortgage rates hit their highest point since 2008 during the middle of June 2022 and as of August, those rates have finally dipped below 5%—a four month low.
This creates an interesting environment for buyers with not only lower rates but a record share of listings along with price drops. There is still an inventory shortage, but it is finally beginning to trend in the other direction.
“Homebuyers may catch a break this month as rates have come down nearly a point from the recent high on fears of a recession,” said Redfin Deputy Chief Economist Taylor Marr. “There are deals to be had on some homes that have been sitting on the market with reduced prices. General economic uncertainty may continue to keep a lid on homebuyer demand and keep mortgage rates volatile, but the labor market remains a beacon of strength in the economy and the housing market in particular.”
For the week ending August 4, 30-year mortgage rates fell to 4.99%, the lowest level in four months. This was down from a 2022 high of 5.81% but up from 3.11% at the start of the year.
And Rental Prices …
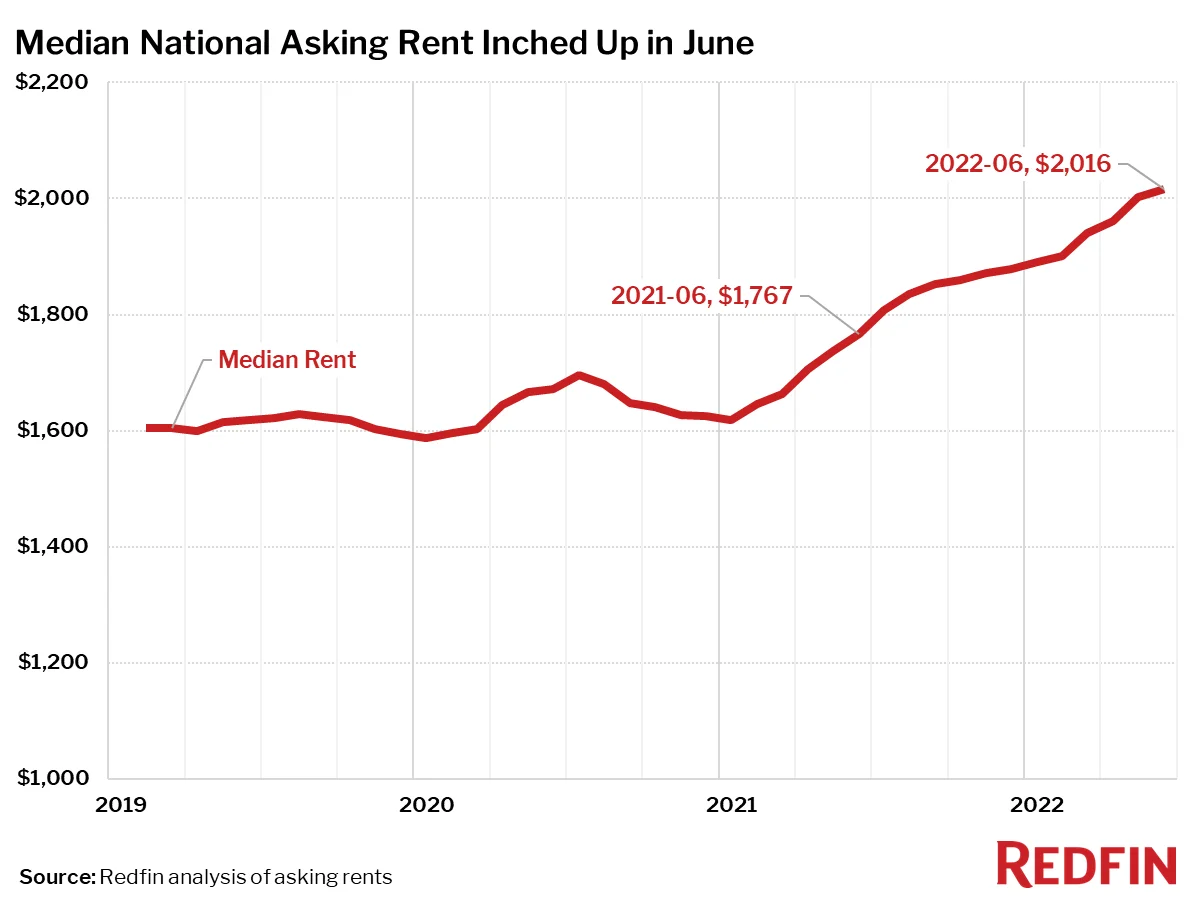
Rent prices continue to rise but slowed down in June. According to Redfin, the national median asking rent rose 14% from a year ago and was up 0.7% from May, the smallest month-over-month gain since the start of the year.
Looking Ahead
Home prices and mortgage rates could find a comfortable resting place that allows buyers to stay in the market.
Nationally, home prices increased 18.3% year over year in June. But CoreLogic projects that year-over-year appreciation will drop to 4.3% by June 2023.
Deputy Chief Economist for CoreLogic, Selma Hepp explains, “Slowing home price growth reflects the dampening consequence of higher mortgage rates on housing demand, which was the intention. With monthly mortgage expenses up about 50% from only a few months ago, fewer buyers are now competing for continually limited inventory. And while annual home price growth still exceeds 20%, we expect to see a rapid deceleration in the rate of growth over the coming year. Nevertheless, the normalization of overheated buying conditions should bring about more of a balance between buyers and sellers and a healthier overall housing market.”
New Opportunity. New Western.
There is no time like the present for real estate investors to capitalize on timely opportunities. With an ever-changing market, it’s critical to have a pro in your corner who can uncover the right deals to fit your investment strategy.
New Western agents are constantly identifying value-rich opportunities for our clients. Let us help you discover the one that fits your strategy.
Contact us to see if you qualify for access to our exclusive inventory.


